The three numbers
Three metrics. One heat day. Three different decisions.
What the wall thermometer tells you
A thermometer reports one thing: the temperature of the air immediately surrounding the sensor. One number, one sensor, one point in space. The reading is only as good as where the instrument sits.
That siting question was settled in 1864. Stevenson 1864 described a louvered wooden enclosure — the Stevenson screen — that became the global reference instrument. The rules: 1.2 m to 2.0 m above ground, freely ventilated but shielded from direct sun, away from paved surfaces that radiate heat, away from HVAC exhausts. The WMO-No. 8 CIMO Guide codifies this as the international standard a century and a half later. Every official air-temperature reading you've ever seen came from an instrument following those rules — or should have.
Two thermometers 50 m apart can disagree by 10 °C and both be correct. Asphalt radiates stored heat into the air column above it; grass stays cooler through evapotranspiration. Still air in a sunlit courtyard is 5–8 °C warmer than air in a shaded breezeway twenty meters away. Rooftop instruments read differently from ground-level ones. "Air temperature" is always a local measurement, not a property of the sky.
The figure below shows what the Stevenson screen shields the thermometer from. Inside the louvered box, the sensor sees only dry-bulb air temperature. It does not see relative humidity. It does not see how hard the sun is working on a body standing next to it. It does not see the wind carrying heat away from exposed skin. It does not see whether the person reading it has been working for four hours or four minutes.
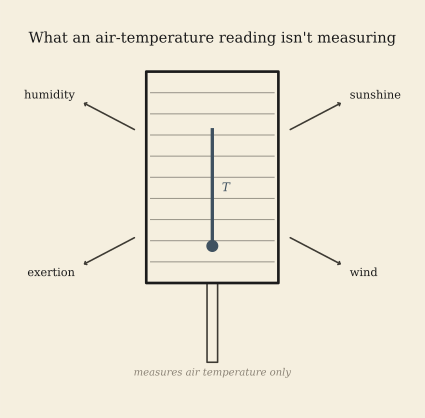
A wall thermometer in direct sun, mounted on a south-facing brick wall, above a parking lot, next to a dryer vent, will read 15 °C high. A screen-mounted station instrument two blocks away will read correctly. Both numbers appear in the same "current conditions" dashboard.
To start accounting for humidity, the next chapter introduces the heat index.
What it feels like
The body cools by sweating. Sweat evaporates and carries heat away — but only if the surrounding air is dry enough to absorb vapor. Humid air is already nearly saturated. The evaporative gradient collapses. Sweat stays on the skin. The body's primary cooling pathway narrows. Apparent temperature — the perceived thermal load — rises.
Steadman 1979 built the first systematic model of this effect: a lookup table combining dry-bulb temperature and dewpoint, calibrated against a clothed human body walking at a moderate pace. The table was rigorous but not broadcast-ready. In 1990, NWS SR-90 — Lans P. Rothfusz at NWS Fort Worth — fit a polynomial regression to Steadman's table. That regression is what every NWS heat index forecast has run since, and it's what this page implements.
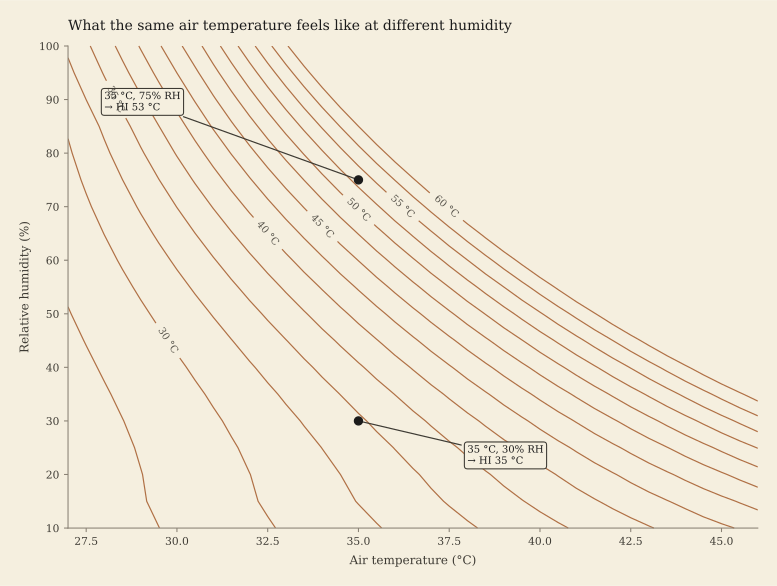
The polynomial does something the raw table obscures: it makes the humidity gradient visible as a single number. At 35 °C air temperature and 30% relative humidity, the heat index is roughly 34 °C — barely above the thermometer reading. At 35 °C and 75% RH, the heat index reaches 41 °C. Same air temperature. Seven degrees of felt difference, driven entirely by moisture in the air.
The nomogram below makes this gradient visible. The horizontal axis is air temperature; the vertical axis is relative humidity. The umber contour lines are heat-index isopleths — the same "feels like" temperature traces diagonally across a wide range of T/RH combinations. Two annotated points sit at 35 °C air temperature: one dry day (30% RH) and one humid day (75% RH). The gap between them is not a rounding artifact. It's the difference between heat illness risk levels.
What the heat index does not see: solar radiation. A worker standing in direct midday sun absorbs 700–900 W/m² of radiant load above and beyond the air temperature. Wind speed. Convective cooling from air movement over exposed skin is substantial — a 10 km/h breeze at 35 °C provides meaningful cooling that the Rothfusz polynomial never accounts for. Work intensity. A body generating metabolic heat from carrying loads adds internal heat production that no weather measurement captures. Clothing. PPE — hard hats, Tyvek suits, gloves — traps heat between the body and the air no matter what the thermometer says.
To account for sun, wind, and the actual workload on a body, the next chapter introduces WBGT.
What it does to a working body
Wet-bulb globe temperature is not a weather metric. It's an occupational one. WBGT was designed to answer a specific question: given this environment — the air, the sun, the wind — how fast is the heat load on a working body accumulating? Air temperature and heat index don't answer that question. WBGT does.
The origin is precise. In the 1950s, recruits at Parris Island, SC were dying during summer training. Yaglou & Minard 1957 — a CSM-CDC collaboration — instrumented the training grounds and found that a three-thermometer weighted average predicted heat casualties better than any single measurement. That weighted average is WBGT. Every occupational heat standard since — NIOSH, ACGIH, ISO, OSHA — traces directly to that Parris Island work.
The three thermometers work as follows. The dry-bulb thermometer (Td) is ordinary air temperature — the same reading as the Stevenson screen. The natural wet-bulb thermometer (Tnwb) is a standard thermometer with a water-soaked wick wrapped around the bulb, exposed to natural airflow — not artificially ventilated. Evaporation from the wick cools the reading; how much it cools depends on the combined effect of humidity, wind, and radiant load. The black-globe thermometer (Tg) is a matte-black 150 mm hollow copper sphere with a thermometer at its center. It absorbs solar and reflected radiation, rises above air temperature in proportion to the radiant load, and falls back toward air temperature in wind. The outdoor WBGT formula combines all three: WBGT = 0.7·Tnwb + 0.2·Tg + 0.1·Td.
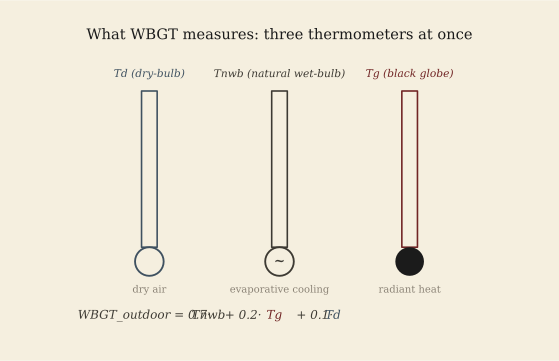
The 0.7 weight on the wet bulb is not arbitrary. It reflects the dominance of evaporative cooling in human thermoregulation. When a body is working hard in heat, sweat evaporation accounts for the majority of heat dissipation — more than convection, more than radiation. The wet bulb is the best single sensor for whether evaporative cooling is available. The 0.2 on the globe and 0.1 on the dry bulb account for radiant and convective load respectively.
What WBGT still doesn't see: clothing and PPE. A Tyvek suit insulates and blocks evaporation; NIOSH 2016-106 §6 provides WBGT correction factors by garment type that add up to 10 °C equivalent load. Acclimatization. A heat-adapted worker can sustain labor at WBGT values 5–7 °C higher than a first-week new hire — NIOSH 2016-106 §6 and ACGIH 2025 TLV both carry separate columns for acclimatized vs. unacclimatized workers. Individual fitness and health. Work rate. The NIOSH and ACGIH tables are keyed to four work-intensity levels: light, moderate, heavy, very heavy — the metabolic heat generation per hour is as important as the environment.
Measurement protocol matters. ISO 7243 specifies sphere diameter, wick material, ventilation conditions, and calibration procedure. A WBGT reading made outside ISO 7243 protocol isn't a defensible occupational measurement — it's an approximation. This page computes approximations. An inspector's reading at your jobsite, made with calibrated instruments under ISO 7243 protocol, is the defensible one.
With three numbers in hand, the next chapter compares them on the same days.
Same day, three numbers
Five real moments. Same body, same week, different metrics. Watch which number drives the call.
Each of the five chips above represents a documented, hand-curated moment from real conditions. The numbers are not estimates of a "typical" summer day — they are specific readings from specific places and times. What unifies them is that all three metrics are live, and none of them agree.
Phoenix at noon and Houston at dawn have almost nothing in common. Phoenix's desert air is 14 °C hotter, but humidity sits at 18% — evaporation works. Houston's air reaches only 28 °C, but dawn humidity peaks near 92%. The wet bulb barely drops. WBGT for Phoenix sits roughly 11 °C below air temperature; WBGT for Houston sits less than 1 °C below it. Humidity shapes how much of the heat budget evaporation can carry.
Yuma tells the same dry-desert story at higher intensity: 44 °C air, 14% RH, full midday sun. The heat index shows 42.65 °C — nearly in agreement with the thermometer, because the heat index correction for very dry air is minimal. WBGT reaches 31.05 °C. All three metrics point the same direction. In conditions this extreme, the disagreement between the numbers is small — all three say stop work.
The indoor warehouse case is harder to read from a weather app. The air thermometer reads 29.4 °C. The heat index — 32.63 °C — is modestly elevated. Neither number triggers instinct. But the indoor WBGT, computed from wet-bulb temperature with zero air movement and 65% relative humidity, reaches 25.8 °C. That crosses NIOSH's moderate-work threshold. The wall thermometer says "fine." The working body says "I am losing the cooling race." The gap between Heat Index and WBGT here is not noise — it is the cost of assuming outdoor wind corrections apply inside a sealed building.
The Lytton, BC case on June 29, 2021 completes the picture from the opposite direction. Air reached 49.6 °C — beyond any recognized work standard. Yet WBGT at 34.31 °C "only" hits the highest documented occupational threshold. Dry air — 12% RH — keeps wet-bulb suppressed even when air temperature is lethal. Air temperature is the screaming warning here; WBGT lags because the physics of evaporation haven't fully collapsed. This is why no single metric is the universal oracle.
Flip through all five scenarios. Three metrics. Five situations. No two moments where all three reach the same conclusion at the same time.
The divergence map
Where the three metrics agree, and where they don't. Each cell is painted by the metric most in warning territory.
Each cell in the map above represents one combination of air temperature and relative humidity. The color tells you which metric — air temperature, heat index, or WBGT — is most deeply in warning territory at that point. The colors are not decoration: they are the encoding. Cream means none of the three metrics have crossed a warning threshold. Slate blue means air temperature alone is the screaming alarm. Umber means heat index has breached its threshold more severely than the other two. Oxblood means WBGT has.
In the lower-left quadrant — cooler temperatures, any humidity — the cream dominates. All three metrics agree: no single warning is triggered. The eye can rest there. That is the "safe" zone, and its size shrinks as you move toward the upper right.
In the upper-right quadrant — humid and hot — heat index dominates. At 35 °C and 85% relative humidity, heat index reaches 50+ °C. The evaporative gradient has collapsed; the body cannot shed heat through sweat when the air is already nearly saturated. Air temperature alone underreports the strain. Heat index catches what the thermometer misses.
In the lower-right quadrant — dry and very hot — air temperature takes over as the dominant warning signal. At a desert 44 °C and 14% relative humidity, the heat index correction is small: dry air means evaporation still works, and the Rothfusz polynomial barely inflates the reading. Air temperature is not wrong here; it is reading the most direct threat accurately.
Between those two zones is a band of oxblood — WBGT-dominant — running roughly diagonally from 32 °C and 30% RH up toward 40 °C and 50% RH. This is the sliver where solar load matters most: humidity is high enough that the dry bulb is no longer the limiting factor, but not so high that the heat index has run away from physical reality. Here the black globe carries the warning. A field crew working in this band with a wall thermometer alone would systematically underread the threat.
Toggle to indoor. The oxblood WBGT band disappears entirely. Indoor WBGT uses no globe thermometer — without solar radiation, the formula collapses toward a humidity-weighted wet-bulb average, and the heat index always out-breaches it on the normalized scale. This is itself a finding: WBGT measurement earns its keep outdoors. In an indoor warehouse at moderate humidity, heat index does most of the same work. What the toggle reveals isn't a shift in the color regions but a shift in what the readout panel tells you — outdoor WBGT runs measurably higher than indoor WBGT at the same air conditions, because the 0.2 globe weight is carrying real solar load when you are outside.
"Feels like" is the wrong question when the question is whether the working body is shedding heat fast enough. Heat index answers "how uncomfortable is this air?" WBGT answers "how hard is the body working to stay in balance?" The map shows where the answers diverge most sharply.
Where each metric fails
An honest accounting. Each metric was built to answer a specific question. None was built to be a universal oracle.
Each card above lists what that metric was not designed to see. The limits are not flaws — they reflect the design constraints of instruments built for specific purposes. A wall thermometer was designed for weather observation, not occupational safety. The Rothfusz heat-index polynomial was fit to forecast comfort for a pedestrian in shade, not for a construction worker in direct sun wearing PPE. WBGT was designed to predict heat casualties on a military training ground — a good proxy for occupational settings, but still missing variables that a full physiological model would need.
The right way to think about them is as a layered sensor system, not as competitors. Air temperature provides screening: if it is cool, none of the other metrics will alarm. Layer heat index for humidity-aware comfort warnings: if the air is warm and humid, the felt load rises. Escalate to WBGT for jobsite work/rest calls: if WBGT is high enough to cross NIOSH thresholds, the body's heat balance is under measurable strain regardless of what the thermometer says.
One variable is hidden across all three metrics: time of exposure. None of them captures how long a worker has been in the heat. A WBGT reading at 28 °C matters differently for a worker who has been outdoors for six hours than for one who arrived fifteen minutes ago. Acclimatization protocols — the NIOSH recommendation to ramp up heat exposure over the first seven to fourteen days — address this separately, because the numbers alone cannot.
The next two chapters show how to use this in practice: first with a sandbox calculator where you can enter your own conditions, then with a live query to the National Weather Service for current conditions at any U.S. station.
Try it
Two ways to ground the divergence in your body. Drag the sliders manually, or pull current conditions for a location.
Both modes compute the same three metrics from the same Python-and-JS formulas that drive the rest of the site. In manual mode, you pick the inputs. In location mode, NWS reports the current air temperature, dewpoint (which we convert to RH), and wind for the gridpoint nearest your lat-lng; we estimate solar load from cloud cover and time of day.
What sliders to play with first: hold air temperature at 35 °C and slide RH from 20% to 80%. Watch the heat index move dramatically while WBGT moves moderately — humidity dominates the perceived load. Now hold RH at 50% and slide solar from 0 to 1000 W/m². Watch WBGT rise from a "mild" reading to a heavy-work warning zone while air temperature and heat index stay flat. The wall thermometer didn't notice the sun came out.
In location mode, NWS doesn't directly report solar — we approximate it from cloud cover plus the sun's elevation at your time and place. That's an estimate, not a measurement. An actual jobsite reading would come from a calibrated WBGT meter sited per ISO 7243. The site reading is what matters for compliance; this panel is for orientation.
How professionals use these
The previous chapters introduced three metrics and the divergence between them. This chapter is for the practitioners — the safety officers, compliance specialists, EHS managers, and field inspectors who have to convert these numbers into specific work/rest decisions on specific days.
The short version: the wall thermometer is the worst of the three for any decision that matters. Heat index is what triggers heat-priority days under the OSHA Heat NEP — not because it's the most physiologically complete metric, but because it's the most widely reported one. WBGT is what supports specific work/rest orders on specific jobsites — and a citation defense without WBGT measurements is structurally weaker than one with.
The table below is the NIOSH 2016-106 §6 recommended work/rest schedule for an acclimatized worker. It's read by crossing WBGT (left column) with work intensity (top row); the cell value is the maximum minutes of work per hour at that combination. Above 32.2 °C WBGT, NIOSH recommends stopping work entirely.
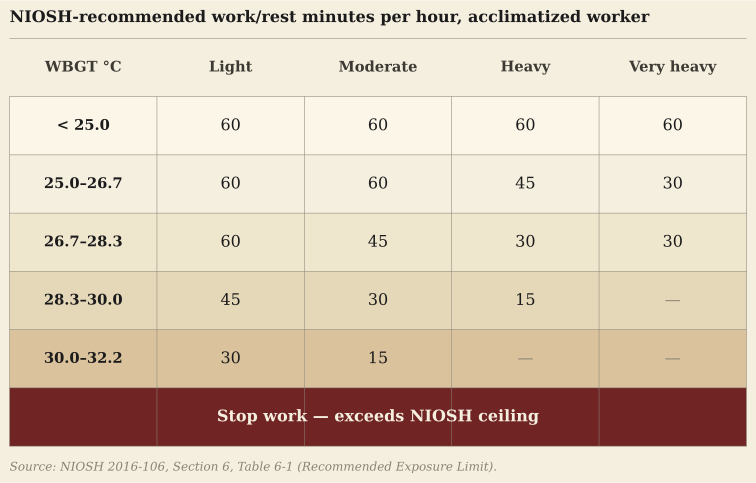
How this plays in practice. An OSHA inspector arriving at a jobsite with a calibrated WBGT meter and a documented work-intensity classification can write a citation that references this table directly. The same inspector with only an air thermometer cannot — there is no NIOSH or ACGIH work/rest table keyed to air temperature. Heat index is the trigger for a heat-priority day, but it is not the tool for specific work/rest orders; that is WBGT's job. NIOSH 2016-106 §6 The federal NPRM, when finalized, will likely require employers to use Heat Index for the initial trigger and to maintain WBGT-equivalent measurement capability for the high-heat trigger. Federal NPRM 2024
For unacclimatized workers — new hires, returning workers after a 7+ day absence — these thresholds shift downward by 2.5–3 °C WBGT. The ACGIH TLV documentation has the adjustment tables; NIOSH §5 has the canonical acclimatization protocols. The first 14 days of new heat exposure carry the highest risk; NIOSH recommends a staged ramp where workers build from 20% of expected heat load to 100% over five days. Most heat fatalities in published OSHA case files occurred within the first three days on the job — before any physiological adaptation can take hold. ACGIH 2025 TLV
The lab ends here. The next stop, if you want to follow how this site was built and what trade-offs ran through it, is the colophon below.
Colophon
This is a lab, not advice. The formulas here approximate published research within documented tolerances; they are not substitutes for an inspector's calibrated reading at a real jobsite, and they are not medical advice. If you are experiencing heat illness, call a doctor.
Sources cited in this lab
- Stevenson, T. (1864) — origin of the louvered weather-screen siting standard
- WMO-No. 8 (CIMO Guide) — global standard for meteorological instrument siting
- Steadman, R. G. (1979) — apparent-temperature model, foundation of NWS Heat Index
- Rothfusz, L. P. (1990) NWS Tech Memo SR-90 — operational Heat Index polynomial
- Yaglou & Minard (1957) — Parris Island study, origin of WBGT
- NIOSH 2016-106 §6 — work/rest tables for occupational heat exposure
- ACGIH TLV (2025) — Heat Stress and Heat Strain threshold limit values
- ISO 7243:2017 — international standard for WBGT measurement
- OSHA CPL 03-00-024-0 — Heat National Emphasis Program, renewed 2026-04-10
- Federal NPRM 2024 (89 FR 70698) — pending federal heat rule
How this site was built
heat-metrics-lab is the Anthropic-tooling counterweight to its sibling heat-protein-lab (which was built in Antigravity 2.0 with Google's Stitch + Science Skills). This site was built entirely in Claude Code with the Anthropic skill/MCP ecosystem. The full A/B comparison post lives on craigmerry.com (forthcoming). Source on GitHub; MIT licensed; no analytics, no accounts, no third-party scripts at page load.
Data manifest.
5 scenarios at /data/scenarios/,
outdoor + indoor divergence grids at /data/divergence/,
4 diagrams at /data/diagrams/,
10 citation references at /data/references/,
12 drift-gate reference cases at /data/references/reference-cases.json.
All generated at build time by Python scripts under /scripts/;
JS-vs-Python formulas validated at 0.5 °F drift gate in CI.